
UKRLP – 10090133
Our Year 11 outcomes for 2026, and how they compare with 2025.
We help minimise the significant barriers to learning so our students can achieve academic success. We expect students attending to aim for a minimum of 5 GCSEs or equivalent qualifications. Below are our 2026 Year 11 results, each student’s progress from their starting point, and a year-by-year comparison with 2025.
| Measure | 2025 | 2026 |
|---|---|---|
| Year 11 students | 18 | 12 |
| Qualifications achieved | 73 | 52 |
| Average qualifications per student | 4.1 | 4.3 |
| Students with five or more qualifications | 50% | 58% |
| Pass rate | 94% | 100%1 |
| English at Level 1 Certificate (GCSE grade 3) or above | 88% | 70% |
| English at Level 2 (GCSE grade 4) | 35% | 0% |
| Maths at Level 1 Certificate (GCSE grade 3) or above | 47% | 20% |
| Maths at Level 2 (GCSE grade 4) | 24% | 0% |
| Healthy Living at Level 2 | 39% | 58% |
| Mental Health & Wellbeing award | 28% | 58% |
| Science award | 33% | 50% |
| Average time at Liminal (months) | 6.6 | 17.3 |
| Rate of progress, English (levels per year) | 2.0 | 2.92 |
| Rate of progress, maths (levels per year) | 1.8 | 3.02 |
1 Every recorded 2026 entry was a pass; one student’s results are still pending. 2 Excludes one student who attended for under two weeks. Percentages for English and maths are of students entered for that subject. 2025 figures are taken from the results published on our previous website, where progress may have been calculated slightly differently.
Every qualification achieved by each Year 11 student. Students are not named, to protect their privacy.
| Student | English | Maths | Science | CC | H&C | H&B | MHWB | PHWB | HL | Total |
|---|---|---|---|---|---|---|---|---|---|---|
| Student A | L1C | L1C | L1A | – | L1A | – | L1A | L1A | L2 | 7 |
| Student B | L1C | L1EA | – | – | – | – | – | – | – | 2 |
| Student C | L1A | L1A | L1A | – | – | L1C | L1A | L1A | L2 | 7 |
| Student D | L1C | L1EA | L1A | – | – | – | L1A | L1A | L2 | 6 |
| Student E | L1C | L1EA | L1A | – | L1A | – | L1A | L1A | L2 | 7 |
| Student F | L1EA | L1EA | L1A | L1C | – | – | L1A | L1A | L2 | 7 |
| Student G | L1A | – | – | – | – | – | – | – | – | 1 |
| Student H | L1C | L1A | L1A | – | – | – | L1A | L1A | L2 | 6 |
| Student I | Results pending | – | ||||||||
| Student J | L1C | L1C | – | – | – | – | L1A | L1A | L2 | 5 |
| Student K | L1C | L1EA | – | L1C | – | – | – | – | – | 3 |
| Student L | – | L1A | – | – | – | – | – | – | – | 1 |
L1A Level 1 Award (GCSE grade 1) L1EA Level 1 Extended Award (GCSE grade 2) L1C Level 1 Certificate (GCSE grade 3) L2 Level 2 (GCSE grade 4)
CC = Child Care · H&C = Hospitality and Catering · H&B = Health and Beauty · MHWB = Mental Health and Wellbeing · PHWB = Personal Health and Wellbeing · HL = Healthy Living. A dash means the subject was not entered.
How far each student moved from their baseline assessment in English and maths, and how quickly.
| Student | Time at Liminal (months) | English | Maths | ||
|---|---|---|---|---|---|
| Levels gained | Levels per year | Levels gained | Levels per year | ||
| Student A | 37.0 | +5.6 | +1.82 | +4.0 | +1.30 |
| Student B | 32.0 | +5.0 | +1.88 | +4.6 | +1.73 |
| Student C | 27.2 | +3.0 | +1.32 | +4.0 | +1.76 |
| Student D | 35.8 | +5.9 | +1.98 | +3.0 | +1.01 |
| Student E | 13.7 | +2.1 | +1.84 | +2.3 | +2.02 |
| Student F | 11.1 | +2.8 | +3.03 | +3.2 | +3.46 |
| Student G * | 5.3 | +2.0 | +4.55 | – | – |
| Student H * | 5.3 | +3.0 | +6.73 | +1.9 | +4.26 |
| Student I * | 2.1 | – | – | – | – |
| Student J * | 5.1 | +1.3 | +3.04 | +2.8 | +6.55 |
| Student K * | 0.3 | +1.8 | +67.50 | +0.3 | +11.25 |
| Student L * | 1.2 | – | – | +0.5 | +4.97 |
| Average | 17.3 | +3.3 | +2.91† | +2.7 | +3.01† |
Levels gained run from each student’s baseline assessment on entry to their final qualification. Levels per year spread that gain over the time the student attended. * These students attended for under six months, so their levels-per-year figures are very high and should be read alongside the time they attended. † Average excludes one student who attended for under two weeks; including them, the averages are +9.37 (English) and +3.83 (maths).
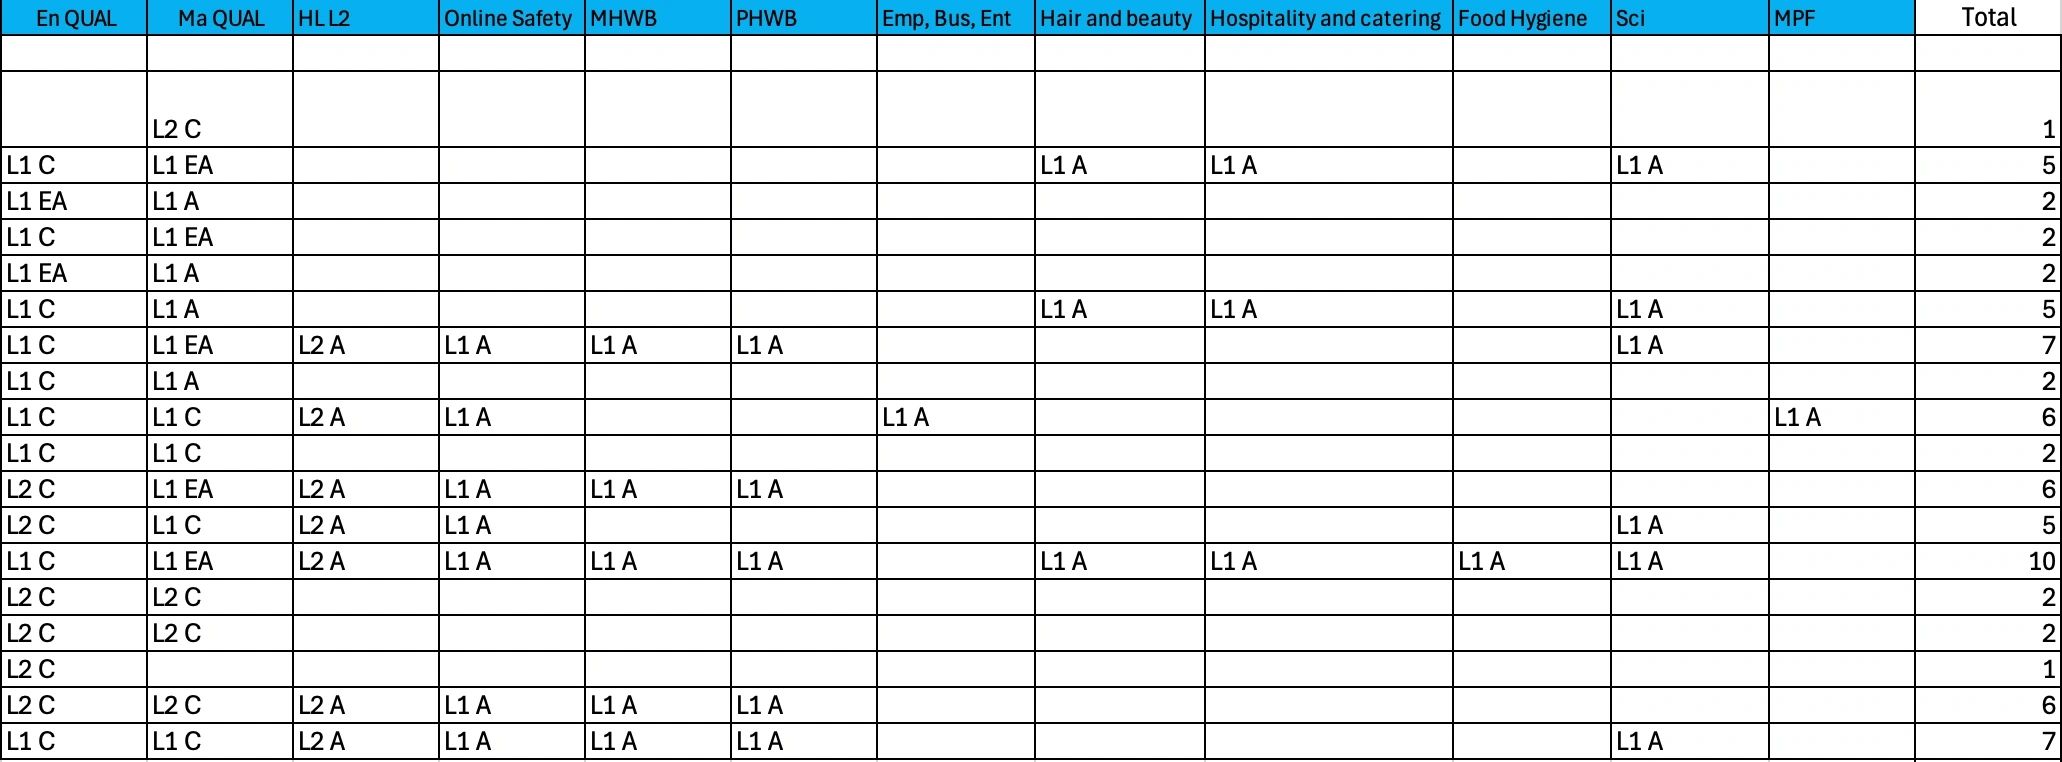
These are the 2025 tables as published on our previous website.
Table 1: the level of progress in English and maths for each Y11 student, the rate of progress and the time each student attended Liminal Education.
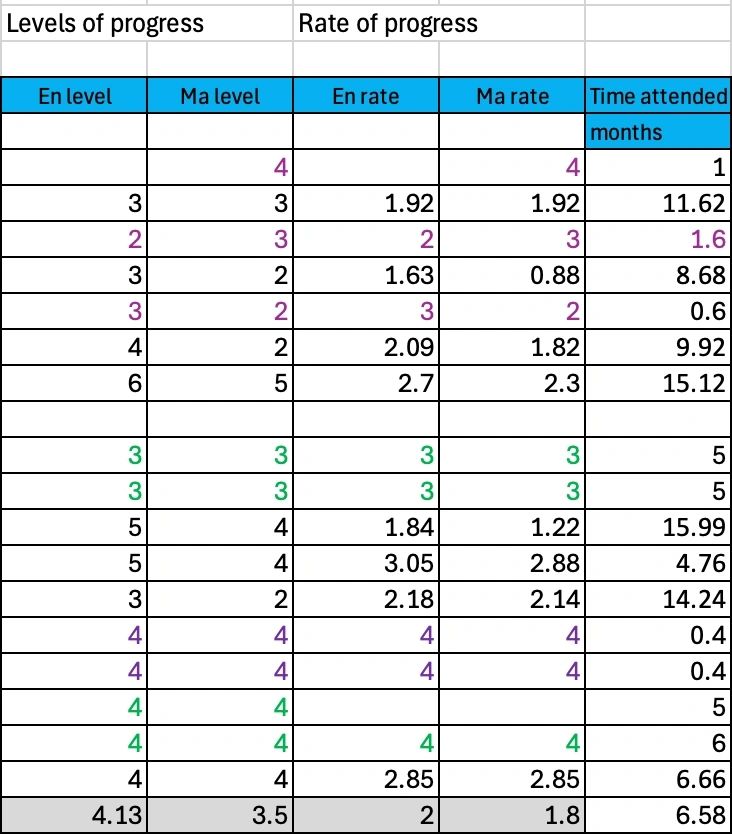
Table 2: total qualifications achieved by each Y11 student. Not all students were commissioned to complete multiple qualifications.
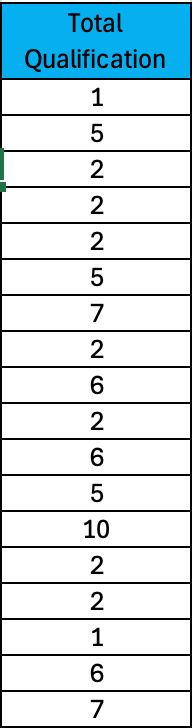
Table 3: the level of accredited results achieved by each Y11 student.
Contact us to discuss how we can support your students’ progress.